BUSINESS PROCESS REENGINEERING

I  have  addressed many  of  the  principles around  business process reengineering (BPR) in the previous articles. What will make this article different is that it will describe how to prepare for, and run, a BPR workshop and program of improvement. It will repeat a few of the points covered in previous articles, as the concepts are inherently intertwined.

To run a successful BPR project requires context. The easiest way to build context is to establish a table that disaggregates  the business from the macro to the micro. Industry language describes this as going from level 1 to level 4. Level 4 is the generic term for the detailed process map, but in practice the disaggregation may drill down to level 5, 6, or 7.

There is no right or wrong, but it is worth considering that if you need to drill down to levels 6 or 7, then you may be narrowing the definition of process too much. This will make it very difficult to keep the process in context.

The disaggregation is represented  as follows:

Process stack and decomposition

To operationalise this picture prepare a table with the following or similar headers.

10

The description fields are important as they force the author to think critically about the separation between the processes they are intending to map. It may not be possible to complete all the fields in the first instance. It is recommended that you do not start mapping processes  until the data for that process is agreed. Ideally the table will be included in the statement of work.

For the process mapping workshop, you will need a decent size white board, a data projector, and a laptop. The workshop participants should be staff who are very familiar with the process. This may mean that you need more than one “subject matter expert” in the room to adequately cover all aspects of the process.

The following guidelines will add rigour to your process mapping.

1.   Model the process using roles not positions.

2.   Only one role can be responsible for an activity. Another role can contribute to the activity, but they are not responsible.

3.   The input from all trigger processes should be sufficiently consistent with the unit of measure being used in the process. A trigger process is a process that precedes the process you are working on. The output from that process is the input to the next process.

At the very least, the following data should be collected in the workshop, or as a result of the workshop:

•     Unit of measure—what is “processed.” It provides a means for calculating the annual volume.

•    Annual volume—can be broken down to weekly or monthly.

•    Process owner.

•    Process deliverables/product.

•    Distribution list for reports.

•    Trigger processes.

•    Hand-off processes.

•    Roles.

•    Indicative role costs.

•    Process activities.

•    Process sequence.

•    Decision points.

•    Percentage splits on each decision.

•    Work time for each process activity.

•    Cycle time for the process.

•    Technology used for each activity. Extended data requirements can include:

•    Information gathered at each step.

•    Status changes in the item being processed.

•    Descriptions of each activity. This may include work instructions.

It is important to establish early on whether you want to draw or model the process. It is almost impossible to adequately collect and evaluate the level of information described above if you do not use process-modelling software. If you use software that only captures the process as a flow sequence, such as Ms Visio, and different software applications such as Ms Word and Excel to capture the additional detail, then you are drawing. In this case you will not be able to complete the analysis described below.

Modelling  software allows you to capture the details of the process in the third dimension. That is, you can capture all supporting information in the application at the time of mapping the process. The concept is: write once, use many. There are a range of applications on the market that support this type of process modelling.

To start the workshop, ask the participants to confirm the data collected in the process definition worksheet. Then ask one of the participants to talk you through the process. It is best to have a high-level schema of the process in your head before you start.

Using standard interview techniques, capture the flow sequence on screen in front of everyone. Pay special attention to the words the participants use. Take time to explore inconsistencies or the subtle differences between branches in the flow.

Process map

Once you have documented the process, go back through it and capture the required details for each activity. The most important data are the work time for each step, the percentage splits for each decision, and the role costs. With these three data points you can complete the primary process analysis. An additional data point to collect for each activity is the underlying technology and whether it is manual, batch manual or integrated processing.

Please note the following techniques are only possible if you are using modelling software.

For  the  first round  of analysis, use the  traditional R.A.C.I. (RACI) (Responsible, Accountable, Contributor, Informed) table.

•    The process owner is Accountable.

•    The roles are Responsible.

•     The distribution list for reports and process outputs helps define who are the Informed stakeholders.

•    You may or may not have a Contributor.

The following is an example of a RACI table.

50

The RACI table allows you to confirm you have gathered all the required information and applied it in the correct manner.

The next level of analysis is to confirm how the process fits into the wider business. That is, do the trigger and hand-off processes make sense? In the graphic below the downward arrows represent trigger processes and the upward arrows are hand-offs. Obviously a hand-off process is also a trigger for the next process. In this way process 1 is the trigger process for process 2 and process 2 is the trigger process for process 3 etc. Each process is measured with KPIs  and the relationship between them is measured by SLAs.

Shared Services 3

The third level of due diligence is to understand the process data itself. This is done through understanding the sequencing paths within the process. 

Consider the following process:

22 (2)

It is an amalgamation of four paths or processing sequences. The paths are shown as follows:

Path 1

12

Path 2

Process sequence3 (2)

Path 3

Sales Clerk1

Path 4

Process sequence1 (2)

This analysis will produce two key tables:

1.   The cost to serve.

2.   Full-time equivalents (FTE).

The cost to serve table is shown and provides the weighted average cost for one iteration of the process. This number can be multiplied by the annual volume to get the annual cost.

Cost to Serve

Column 1 references  each way the process can be transacted. In this example there are four paths.

Column 2 is a result of the percentages applied to each decision in the process. (These are not shown in the diagram.)

Column 3 is the activity-based cost of the sum of the activities within each path. The figure is based on the costs associated  with each role multiplied by the time associated with each process step in the path.

Column 4 is the product of columns 2 and 3 and represents the cost to serve of one iteration of the process.

The second table is a staffing analysis. It is a similar analysis as is the cost to serve, but is completed on staffing needs-based FTE requirements. The following is an example. It shows FTEs by path and total FTEs for the process for one iteration.

FTE numbers

The analysis is completed by applying the annual volume to the FTE table. In this case, the annualised staff requirement becomes 1.8 FTEs.

FTE numbers2

Due diligence is to ask: “Does the annualised FTE number make sense? Can the annual volume be completed with 1.8 FTEs?” If you add a productivity factor of 10% or 20% the FTE figure rises to 2 (rounded). If the answer is yes, then you know you have captured the process correctly. If not, then the process data needs to be revisited. The answer does not need to  be precise; rather a “substantially  correct” answer is accurate enough for decision-making.

Once  the  individual processes are agreed, they can be aggregated to provide a holistic view. It is the same table as shown in previous blogs.

 Path analyis table (2)

With this table, process improvement can be prioritised. Assuming the intent is to reduce costs, you read the right-hand column. It shows the relative contribution of the individual process costs to the sum of costs for all processes. It can be seen that the “purchasing” and “new user setup” are the two processes that contribute most to total costs.

To reduce the costs associated with a business process refer to the cost to serve table.

Cost to Serve

Path 1 is the most cost-effective  processing  sequence. The best outcome is to reengineer the process to maximise the volume flowing through this path. This will deliver a savings of $49 per process iteration. If the process is transacted 10000 times a year, then this is a savings of $490,000. If you cannot improve the process to get 100% through path 1, then the next best option is to maximise volume through path 1 and use path 2 for the overflow.

 Moving 100%  of  the  volume to  path  1  can  be  achieved through controlling the decision.

Typically this can be achieved through a change to the:

1.   Staff profile through skills improvement  or behavioural change.

2.   Processing sequence through policy or procedural changes.

3.   Underlying technology through workflows  and configuring the existing system.

A change in skills will require further analysis to be able to answer the questions illustrated below.

training


The approach is to complete this analysis for each step in the process and then aggregate  them into a consolidated table. This table can be cross-referenced to the RACI table to check for completeness. Once this data is collected, it can be cross-referenced to the skill profile of the staff working in the process and improvement strategies developed.

Option  3  is the  best option  as the  application of  technology or  a workflow removes the  option  for  the  process performer to  make a decision in the process. This concept is explored further in the chapter on Judgement Support and Decision-Making.

Recognising that   this  type  of  process change  is  frequently  quite substantial in  its nature, it  is better to  complete the  analysis for all processes as shown in the following table and then develop a business improvement program to meet the change requirements of all processes at once.

100 (3)

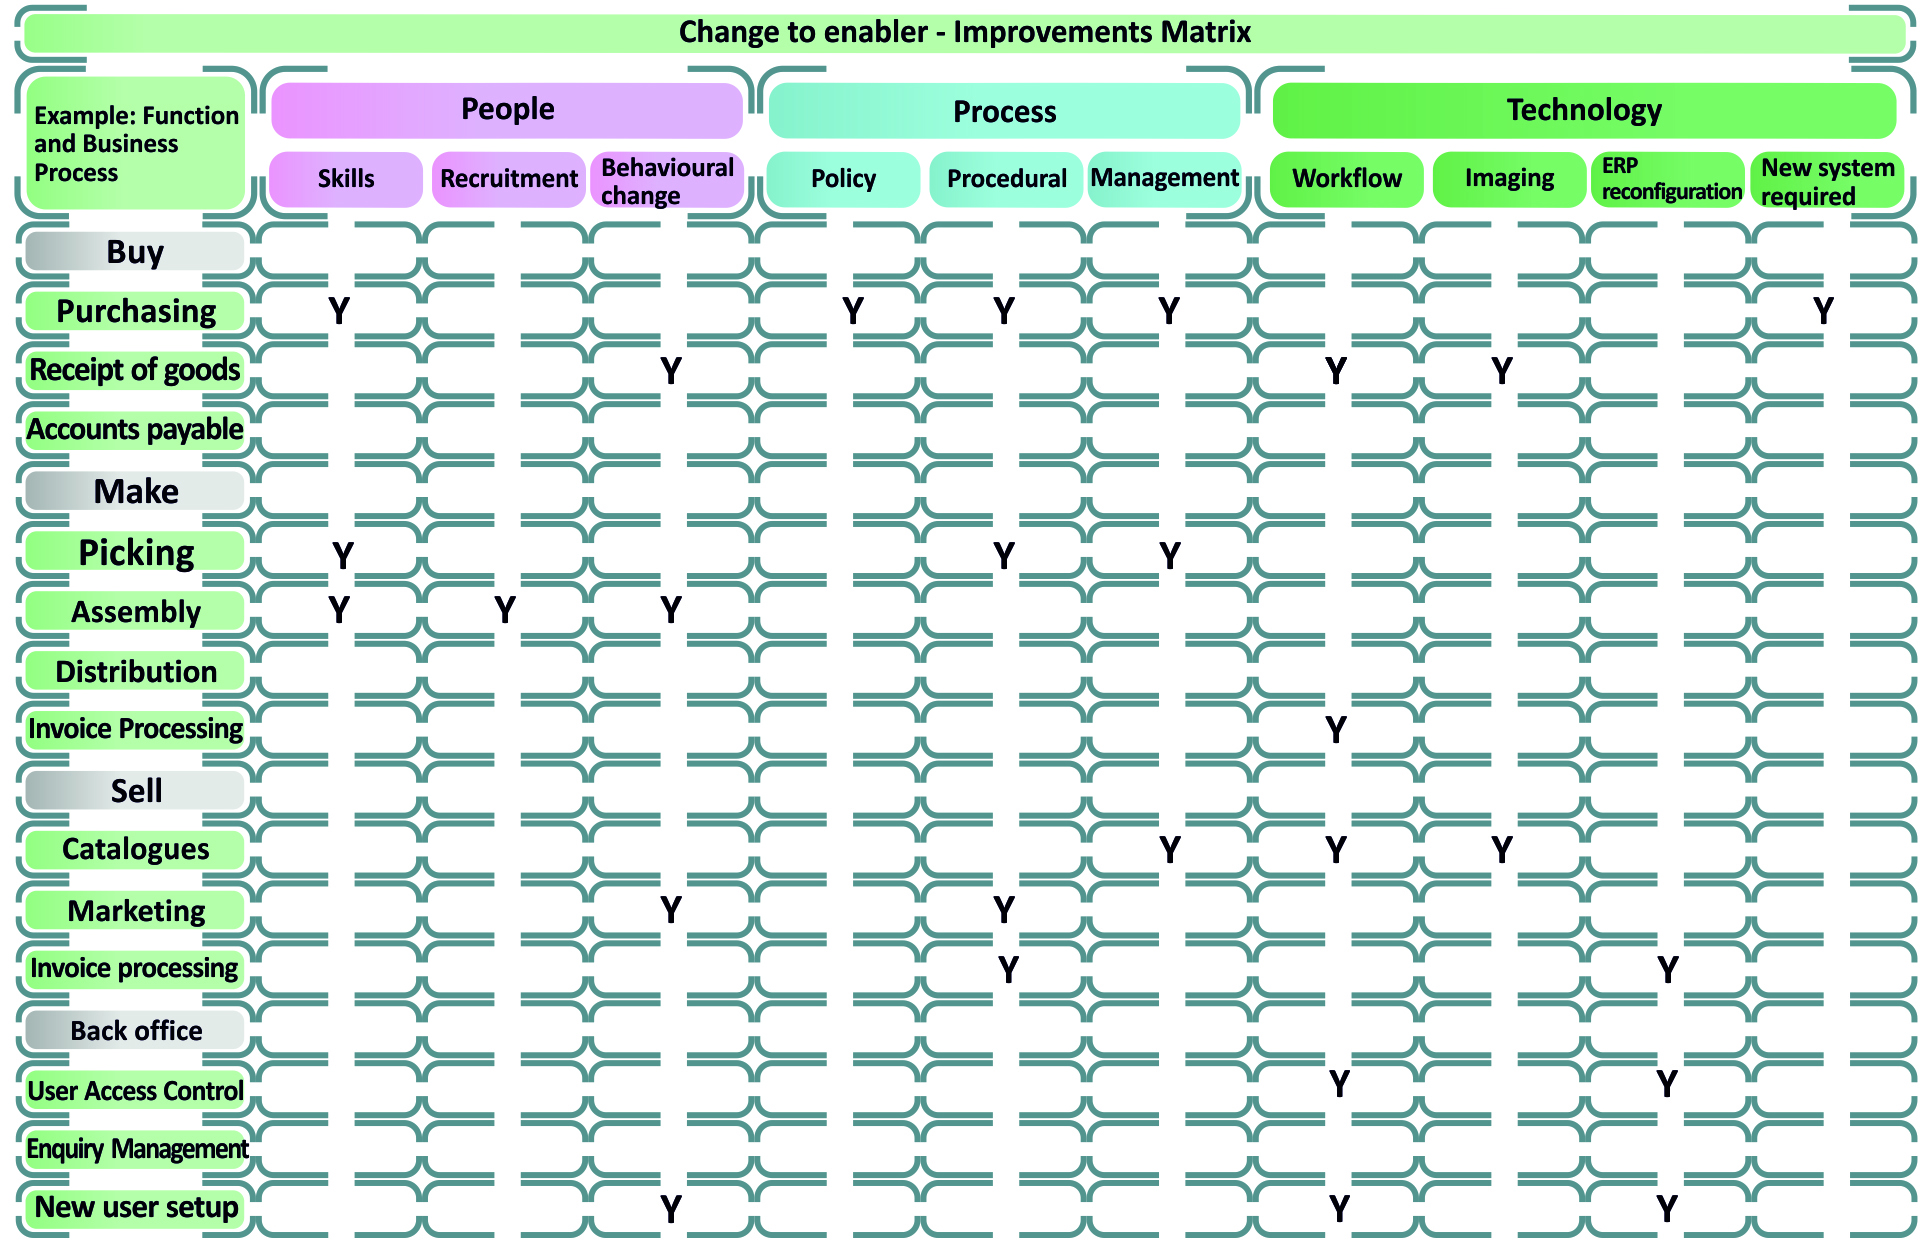
Before implementation commences it is important that the business case for change is validated. The above table identifies the entire program of required improvements and  these improvements are then  used to recalculate all tables described throughout  this chapter. The  expected benefits are then compared to the existing process metrics.

 image005 (2)

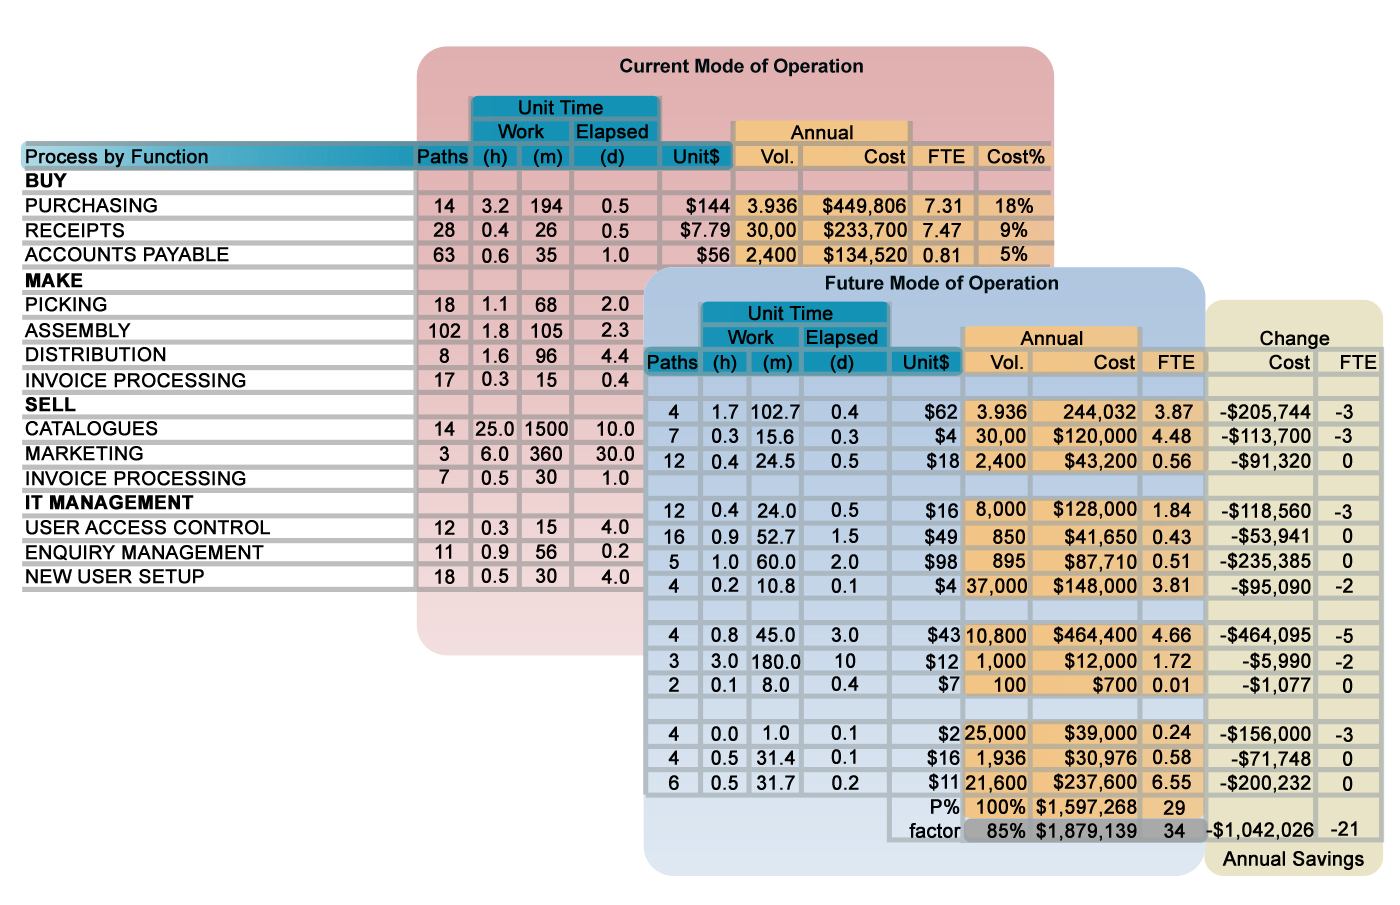
In  this example, a total benefit of more than  one million has been identified with an associated saving of 21 FTEs. The nature of these 21 FTEs can be identified through a comparison of the staff profile tables.

I  close with the  following comments. Business process reengineering is reasonably straightforward to do at the “surface” level, and somewhat more difficult to do at the detailed level. A schematic of a process is just that—a schematic. It is a representation of the routines staff follow on  a daily basis and  to  reengineer the  process requires a change in these routines. To gain the trust of the affected staff requires a rigorous analysis of the processes  combined with a focused program of change management. It is equally important to remember that processes do not exist in isolation and to change a process without understanding how the process interfaces with the rest of the business is likely to reduce the overall benefits received.

SURVEYS AND DIAGNOSTICS

There is a significant body of management science behind the formation, delivery, management,  and  interpretation  of  surveys, sufficient  to fill a series of books in its own right. The intent of this article is only to  provide  the  layperson with  some  guidelines for  preparing  and administering a  survey, suitable for use within  a company or  the customer base.

There are three truths that underpin any change initiative. The first two are:

1.   If you can tell me how you are measured, I will show you how you behave. The principle is that measurement (including the absence of measurement) drives behaviour. So only measure criteria you can change. If you can’t change it, don’t measure it.

2.   People only change when their discomfort is high, caused by “pain” or unrealised “pleasure.” These two points are on opposite ends of the spectrum. If people are experiencing any point in between, then they are unlikely to change. Choose questions that will measure where the respondents are on the spectrum.

A survey is a quick and easy means to measure the survey populations position relative to both points with the second point being easier to measure than the first. The most important feature of a survey is that it is only a snapshot of people’s perceptions at a specific point in time. This brings me to the third truth:

3.   General statements do not  define the specific and the specific does not define general statements.

A survey provides a snapshot in time on general statements only. For example, a survey on customer satisfaction may indicate that customers are highly satisfied with the service  they have received. This does not mean that every single customer is happy and it would not be difficult to find a single customer who was unhappy. All you can conclude from the survey is that generally customers are happy. Equally, just because you found one customer that was unhappy, that does not invalidate the survey.

The biggest mistake in surveys  is measuring what you cannot change. This  issue typically manifests itself  through  broad  questions. The less specific the question, the more it is open to interpretation by the respondent. Consider the question: “Are you happy? Answer yes or no.” This may seem like a specific question due to the binary nature of the answer, but it is actually a very general question. What is “happy?” How do I know when I am happy, or do I measure my happiness the same way as the next person?

Assume a 60/40 split in responses,  yes to no. At best, given the inherent vagueness in the concept of happiness, the most reliable insight that can be inferred from the study, is that, at the time of answering the question, 60% of the respondents were not unhappy. It does not predict if the same people will be happy one minute or one hour later. If your objective was to make everyone happy, then this survey offers no insight into what is making people happy or unhappy. It provides no clue as to what needs to change. In summary, this style of question is a waste of time.

A better approach is break the concept you wish to measure into its component parts, ensuring that  no matter what the answer, you will be able to introduce a change that will improve the result. Assume you wish to survey management’s  perception of the quality of information they receive. The first hurdle is to define the concept of “quality.” As per the happiness example, it would be futile to ask management if they considered the information they received to be of poor or good quality, as you would not know what to change if the answer was that the quality of the information was poor.

To resolve this issue, I define quality information to be information that is complete, accurate, and timely. In other words, I get all the information I want, when I want it and without errors.

Using this definition the first question could be: “Do you consider the information you receive to  be complete?” It  is substantially easier to resolve issues around incomplete information than it is to fix issues of poor quality. A further refinement of the question can be to ask “How often are you required to request additional information for use in the decision-making  process?” as it may not be possible to be confident that everyone defines “complete” the same way.

The  survey is further improved by moving away from using binary answers (yes/no) to using a scale. A scale allows the respondent to be more specific in their answers. The Likert scale is my preference. The primary characteristic of a Likert scale is that it considers all responses to be equal. To set it up, the survey author should write down the question and then,  at a minimum, define each side of the scale. Ideally each response point in the scale will also be labelled.

A Likert scale should comprise at least five choices. The ideal number is eight as it allows the respondent to show a higher sensitivity in how they respond to each question. I prefer using an even number of choices as it forces a decision from the respondent. Using an odd number provides a natural midpoint that  can become the easy choice for respondents not wishing to commit themselves. There is no midpoint with an even number of choices.

The question on completeness now looks like this:

How often are you required to request additional information for use in the decision-making process?

Constantly                                                                Seldom

1          2          3          4          5          6          7          8

The results are presented by totalling the number of times each point is selected, as each point on the scale is equally valid.

I also recommend asking the question twice. The first question is to evaluate the current position and the second is to determine the ideal or desired position.

The results graph could look as follows:

Completeness - Managers - revised


The current position is in front and the ideal position at the back.

From the graph it can be seen that of the 160 respondents (managers within the business), 40 rated the current completeness of information as 2, 20 rated it with a 3, 0 rated it with a 4, 30 rated it with a 5 and 20 rated it at each of 6, 7 and 8.

The important point is that there is no trend line. It is only a series of discrete scores.

From the graph it can be extrapolated that the vast majority of managers consider the information they receive to be incomplete. This is an easily accepted result. What is unexpected is that approximately 60% of managers have an ideal score of 4, 5 and 6. That is, over half of the survey population do not consider it important to have complete information to do their jobs. (Not all managers responded to the question for the ideal position).

These results can be further enhanced with follow-up interviews to better understand them.

And  further  insight  can  be  gained  through  cross-referencing their responses to the demographic information about the respondents such as seniority, gender, location, function etc.

Once you have established the gap between the current and the ideal position, the question of how to close it arises. My experience is that the gaps are closed through a combination of changes to policy, behaviour, process, and technology. The following table illustrates how this can be worked through:

8

On the left are the criteria measured by the survey. On the right are the four change drivers of behaviour, policy, process, and technology. The numbers represent which of the four drivers need to be addressed to close the gap and are in decreasing order of priority. (1 is highest priority and 4 lowest.)

It can be seen that substantial improvements across all measures can be made by changing or introducing policy supplemented by changes to behaviour and process. Frequently companies jump straight to changes to technology. In this case, changes to technology will help, but they are not the place to start.

A survey can act as a catalyst for change and can provide a baseline prior to making changes. But it is important to keep in mind that it is only a snapshot in time and it only provides answers to the specific questions that you ask.

DRIVING CHANGE — A METHODOLOGY

Implementing change is difficult. Implementing change without a methodology is very difficult. This article will discuss the basics and provide a structure to guide your projects. It will have sufficient detail to be a stand-alone article, but when used in conjunction with the other content from my blog, it will definitely come alive and you will have all the models and structure you need to deliver a successful business improvement  project.

The methodology comprises seven steps. It is important to note that while they are broadly sequential in nature, it is common for two or more steps to be tackled concurrently. This is particularly true for steps 4a and 4b.

Sixfootfour methodology

Step 1: Agree project plan, scope and benefits.

This is a crucial step in successfully establishing a project. Taking the time to get it right will provide a positive return on investment through minimising scrap, rework and failure.

Typically the focus of this step is the preparation of a document describing the project. These documents are normally termed Statement of Work (SOW), Project Initiation Document (PID), or Project Memorandum. Irrespective of the name they include the same generic contents:

  • Business context
  • Project purpose
  • Scope
  • Methodology
  • Approach
  • Timeline
  • Risks and risk management
  • Constraints
  • Change management
  • Staffing
  • Roles and responsibilities

Depending on  the  author  and  company, additional headers may be included  such  as  budget,  success measures, related projects, and  a methodology for  handling  change requests. Traditionally the  project manager is  asked to  prepare the  SOW  and  the  document  is  then presented to the project sponsor and other stakeholders who review and approve it.

The biggest issue with this approach is that the focus is always on the document rather than what it represents; and it is typically always written in a hurry, often within a week. The sponsor reads the document and validates that all the information you would expect to see is there and that the timeline and budget are within bounds of acceptability and then accepts the document.

What is seldom done is for the stakeholders to formally put aside time to workshop the completed SOW to subject it to a rigorous level of due diligence. This workshop would ask questions such as:

1.   Is there a common understanding of the project purpose? Even if there is a purpose statement, does everybody interpret it the same way?

2.   Is there agreement on what success looks like?

3.   Does each stakeholder understand and accept what is expected from  them  throughout  the  course of  the  project and  more importantly, after the project?

4.   Is the risk table complete? Does it include project and business risks? Are the mitigation strategies considered practical or are they merely a cut-and-paste from the last statement of work?

5.   How will risks be managed? Merely writing them into the SOW is not managing them.

6.   Is the change management plan aligned to the risk plan?

7.   Does the resource plan make sense?

8.   Does the budget have contingency? How is it calculated?

The sponsor should allow ample time for this workshop. The desired outcome  is  confidence that  the  project is  considered and  that  the stakeholders are fully enlisted in  the  project. Not  just engaged, but enlisted. That is, they are fully and actively committed to its success.

Step 2: Establish project governance.

The due diligence workshop is the first activity in establishing active project governance. Governance is the active mitigation of risk through the proactive management of compliance and performance. Merely to be in business requires the acceptance of a degree of risk. This is no different when embarking on a business improvement project.

Good governance requires the establishment of a hierarchy of committees to manage the project. I have covered these committees in detail in other articles so I will be brief here.

The  phrase “change management” is freely used on  all projects. The reverse, “the management of change,” is not. There is an important distinction between the two concepts and it is oft-times overlooked.

Frequently committee members will attend project meetings, participate in discussions, and then mentally park the project in the back of their mind until the next meeting rolls around. They forget that their role is the active management of change and this requires a substantially higher level of involvement than merely attending a weekly project review meeting.

I suggest that change is managed through a three-tier structure.

32edit

The steering committee is a group of senior managers responsible  for ensuring the overall change program stays on strategy. A key point is that there should only be one steering committee. They are specifically responsible for steps 1 and 7.

The working committee is responsible for driving the tactical change initiatives. There may be two or more working committees depending on the size of the company and the breadth of change. The working committee is specifically responsible for step 6. By comparison, the steering committee is to ensure that the working committees output will meet and promote the company strategy.

Both committees can manage risk, budget, and change, the difference being the scope of authority.

The  project teams are responsible for the  day-to-day delivery of the project activities represented by steps 3, 4 and 5. A common mistake is treating the project committee as the working committee.

Step 3: Determine process metrics.

The purpose of step 3 is to collect and analyse primary data. Typically this step involves mapping business processes. In the methodology, this step is termed “determine process metrics.” This is an important label in the sense it does not say “business process mapping” as is frequently the case with business improvement methodologies. The  essence of this distinction is that it is equally or more important to understand the metrics behind the process than it is to understand the process itself. A methodology to calculate these metrics is covered in the article on process reengineering.

These metrics should be seen in the context of the unit of measure for the process. This step could produce a table as shown.

Path analyis table (2)

In terms of benefits realisation, this table can be used to calculate the benefits and priority of the change to be addressed in step 4a.

Step 4a: Critique and improve the process.

Once you have established the  process  flows  and  associated  metrics for the current mode of operation, you are in a position to determine improvements to the processes. The data will guide the analysis and quantify the benefits of  change.  Without  this  data,  it  is  difficult to confirm that any of the recommendations tabled will result in a substantial improvement. Different is not an improvement.

Business improvements can be achieved from changes associated with people, process or technology and any of their sub-components. The following table illustrates the primary sources of change.

Frequently improvement requires changes to more than one component.

 100 (3)

 Once you have worked out your business improvement strategies, you can quantify the benefits of change by determining the impact of the change on the same base data set from step 3. The results can be tabled as follows.

image005 (2)

Step 4b: Install refined process controls.

The problem with “businesses”  and “processes” is that they don’t  exist, or at least, they only exist in the abstract, as concepts. Fundamentally, businesses  are groups of people working together towards a common objective and processes are the habitual routines they follow to “process” the demand customers place on the company. To change a process requires changing the familiar routines people follow in their daily behaviour.

The guiding principle is “show me how you are measured and I will tell you how you behave.”

This is an important principle as it links steps 4a to 4b. In step 4a the focus is to reengineer the flow of activity through the business. In step

4b the focus is to review and reengineer the measures (KPI’s) used to manage the processes. Frequently there is no need to change the activity sequence (business process) as it is efficient. Rather change is required in the behaviours associated with the activity sequence in order to remove productivity issues such as pacing and “territory disputes.” This change can be achieved, in part or in full, through changing the way the process is measured.

Should the project objective be to specifically  review and improve the business processes, then this activity needs to be completed in conjunction with a  review of the  process measures. This  will prevent substantial investment being spent on defining new processes without concurrently establishing the means to drive the necessary behavioural changes.

Steps 5 and 6: Install and drive behavioural change.

The purpose of these steps is to operationalise the agreed changes. To install change is to change behaviour. Occasionally, changing behaviour is straightforward and happens without difficulty. Frequently this is not the case. To mitigate failure, a project requires effective change management.

The primary purpose of change management is to assist the company to  migrate from  a  project environment to  “business as usual.” My observation is that change managers often worry more about completing the standard activities of change management such as communication and training plans, than focusing on the primary purpose.

Strict management of the relationship between steps 5 and 6 is crucial for a successful project and moving to step 7. Measurement is mandatory to reach the highest levels of success at this time. There are two areas of measurement. The first is traditional operational KPI’s. These need to be aligned to the future state. This may require changing existing scorecards or even introducing new scorecards.

The  second area of  measurement should  be  aligned to  the  change program itself. The change scorecard should include metrics on skills development and staff attitudes. The intent is to measure both axes in the following matrix.

4

Examples are: number of people trained; number and  organisational profile of  staff communicated to;  number  and  nature  of  questions received; survey results; and awareness sessions held.

Step 7: Realise benefits.

This step is the consequence of the prior steps. Success is measured against the business objectives described in the project statement of work and the extended objectives that will have surfaced through the life of the project. 

An oft-missed aspect of change is the need to be uncompromising. As the project “gets real” and staff members are asked to change their behaviour, the sponsor will come under significant pressure to relax their position on what success looks like. A culture of “close enough is good enough” is typical at this time. The point here is to emphasize that resistance to change is frequently invisible. It manifests itself in perfectly logical and plausible arguments that are all aimed at reducing the scale of change and the benefits realised. The staff making the arguments may not even realise that they are being resistant to change.

Mitigating resistance to change requires the manager to be aware of the three stages of change:

Stage 1: Mechanical compliance

Stage 2: Conceptual compliance

Stage 3: Utilisation 

                                                                             Source: Proudfoot

Mechanical compliance is characterised by instructing staff to follow the new procedures and being intolerant of reasons as to why it can’t be done. As staff become comfortable with the new way of working and establish the new routines of working, they will start to better understand the new order and, if the project has been done well, they will start to see the benefits. They are now at the point of conceptual compliance and once they are comfortable with the benefits of the new procedure they will move to the “utilisation” phase and will own the new way of working. When this happens it can be said that the project has fully migrated to business as usual and the benefits will be realised.

STRATEGY DEVELOPMENT WORKSHOPS

This article covers the basics of developing a business strategy. My favourite maxim on strategy management is “The bus that runs over the pedestrian is never the bus the pedestrian is watching.” This maxim reinforces the point that the value of a business strategy is directly related to the assumptions that underpin it.

When establishing a strategy, the first assumption is that the management team formulating the strategy all frame the conversation the same way.

Invariably this is not the case and the book “Reframing Organisations” by Boleman and Deal describes this phenomenon very well.

In their book, they describe four frames through which a manager can view the organisation and environment they work in.

  • The structural frame: a focus on how groups and teams are structured.
  • The human resource frame: a focus on human resource management and positive interpersonal dynamics.
  • The political frame: a focus on power and conflict, coalitions and dealing with internal and external politics.
  • The symbolic frame: a focus on organisational culture.

Recognising that managers may not be aware that they view the organisation differently as do their colleagues, it is important to agree the frame or frames the team will use through the strategy development process. It is acceptable that different managers explicitly adopt different frames to enrich the conversation and ensure groupthink is mitigated. It is only important that everyone knows which frame each person is using through the course of developing the strategy.

The strategy management process is depicted as follows:

1400 (3)


Simplistically, the purpose of a strategy workshop or process is to answer five questions:

1. What business are we in?

a. What is the corporate culture?

b. What is the risk appetite?


2. What is the endgame or, in other words, what does success look like?

a. Asset sale

b. Public listing

c. Family business hand-down

d. Stop investment and take the money in annual dividends.


3. Why will we succeed?

a. Analysis of the operating environment

a. How is value created?

b. Who are the competitors?


4. How will we succeed?

a. S.W.O.T. analysis

b. What is the business model?

c. What is the style and structure of management?

d. What are the priorities?


5. How will we manage success?

a. Organisation structure

b. Compliance management

c. Performance management

The strategy workshop should open with confirmation of the nature of the business, the company culture, and the risk appetite. The nature of the business is to answer the question: “What business are we really in?” Often the answer will revolve around business models such as treasury or risk. These models are then placed in the context of the business they operate in. For example, supermarkets are generally in the treasury business and construction companies are in the risk business. Understanding the company culture will inform the strategy process as to the nature of the risk the company is willing to take on. For instance, a conservative company will not endorse a high risk strategy.

It is difficult to develop a strategy if there is no consensus on the nature of business, culture and risk profile.

The strategy workshop can now move to an analysis of the endgame. The purpose is to establish agreement on the exit strategy. The exit strategy is a statement of how the owners will turn their investment in the asset into cash. Options include: sell it, list it on the stock exchange, or take the cash in billings without actually building the asset. An equally acceptable option is to give it to the kids.

The endgame question informs the investment decision. For example, it is very difficult to sell a professional services business and if the principles wish to exit the business, then investing in the business may not be the best way for them to get value from it. Rather they should maximise their billing and take out the value in dividends over the next few years, then simply close the business and walk away.

The endgame question is equally valid for a public company, but the alternatives are different. There is only one objective for the directors of a public company and that is to maximise shareholder value. This reduces the directors’ endgame to the alternatives of selling the entire company or selling the shares they hold in the company. There are a few additional complex options that are not included in this article.

If the business is saleable, or it is a public company, then the exit strategy will always be to sell the shares for the highest value possible. The business strategy must therefore focus on activities that increase share value in a sustainable manner.

The longest practical time horizon for a strategic plan is three years and many would argue that this is too long, but this depends on the market the company operates in. Developing a three-year strategic plan does not imply that the owners will exit in three years. The time frame is only to provide context for the strategy workshop and if the strategy development process is conducted annually, then the three years becomes a rolling three years. For some markets such as infrastructure development, the investment period is well over ten years.

At the beginning of this article I mentioned the need to manage assumptions. Through the course of agreeing the endgame, a number of explicit or implicit assumptions will have been made and the next stage of the workshop is to expose and critically examine these assumptions and answer the question: “Why will we successfully achieve the endgame?”

The intent of the question is to force an examination of the assumptions made about the market the business operates in (external environment) and the business’s ability to operate in that market (internal capabilities).

There is no right or wrong order in which to approach these two mini workshops. My experience is that workshop participants need to discuss their internal environment before they can properly consider the external environment. The problem with this approach is that it can become very myopic and the thinking becomes constrained to considering what is known, rather than including what is unknown. If the workshop sequence does start with an analysis of the internal environment then it should include a reconfirmation of the results after the external analysis concludes. This will ensure the capabilities considered in the internal analysis adequately address the opportunities and threats identified through the analysis of the external environment.

For the internal analysis workshop to be successful it is important that there is agreement on the core business. That is agreement on the question: “What business are we in?”

Understanding what business you are in, tells you what you must be competent in and, by inference, what the business must be capable of.

Many capabilities create a competency.


11 (2)

Source MGSM

The internal analysis is therefore a review of the existing capabilities against the nature of the business. It is a review of what exists now and what capabilities need to be introduced or enhanced. To guide the identification and classification of capabilities I recommend the B.T.O.P.P. model. It is a simple but practical model for structuring the analysis.

005 copy

It is important to keep the analysis at a high level to avoid getting mired in conversation on the nitty-gritty. The following table provides a good structure for collating the results.

44

Source MGSM

Column A can be renamed “business objective” or “core competencies” or similar. The last column is important. It captures the group’s opinion on what needs to be resolved to close the gap. I recommend using the B.T.O.P.P. model here again to check for completeness. This is in addition to using it for the capabilities analysis. For example, if the desired capability is to be able to establish a “multi-local” distribution chain or to be capable of transacting in multiple currencies, then the issues will be multi-faceted. Using the B.T.O.P.P. model creates a common vocabulary for recording the issues.

There are many models that assist with the analysis of the external environment such as Porters Five Forces (shown below), the P.E.S.T. (Political, Economic, Social and Technological), and P.E.S.T.E.L. (PEST + Environmental + Legal) frameworks.

33

Source: Porters 5 Forces

The results of the analysis can be captured in a table as shown.

1300 (2)


Column A describes the nature of change anticipated in the market.

While the table is simplistic, care should be taken to include as much detail as possible when describing the anticipated change. This may require adding additional columns. Depending on the depth of the analysis, a different table may be used for each analysis topic, or one table for all. The table is intended only to collate the issues, not to solve them so there is no column for mitigation actions.

The internal and external analysis addressed questions 3 and 4 (referred to at the start of the chapter) and provided the raw data required to answer question 5. The workshop is now ready to consolidate the issues and prioritise the actions for the next 12 months, 3 years, 5 years etc. The critical issues framework can assist with this process.

1200 (3)


Source MGSM

The methodology is to use the grid to “sift” the issues gathered through the two analyses to determine the critical issues. It is important to treat the grid as a “relative” analysis in the sense that all the issues are important, but some are more important than others. This means that you should be able to place an issue in all nine cells. Placing an issue in the low priority cell does not mean it is not important. It only means that, of the raised issues, it is of a lower priority. The critical issues are then further analysed as shown.

1100


Source MGSM

The final step in order to conclude this stage of the workshop is to perform due diligence. The approach is to cross-reference the priority actions captured in the previous table to the business objectives discussed at the start of the workshop, or the required competencies highlighted through the capabilities workshop. Using a simple light/dark analysis provides an easily understood summary. Dark shading represents a closer match between the objective and priority.

1000


Cross-references that are overly dark should be examined for completeness. Is the underlying issue fully described and understood? Is the priority correctly applied?

The priorities are then associated with a high-level timeline and the workshop is now ready to answer question 5: “How will we manage success?”

900 (2)


On the basis of “a journey of a thousand steps starts with the first step,” the purpose of question 5 is to ensure there is agreement on the tactical changes or projects required to execute the strategy. The timeline provides the priority.

I close with the observation that managers frequently do not allow enough time for everyone to fully consider the points being discussed.

The commonly heard statement is, “Let’s just get something down on paper and we can refine it over email.” This approach may improve efficiency but it destroys the debate. It is recommended that each activity in the workshop is addressed twice, if not three times. If it is a two-day strategy session, then repeat Day 1 on Day 2 to give people overnight to really think about the issues. Then hold a further review a week or two later.

DRAW THE PICTURE

Two of the biggest difficulties in the work environment are a) being able to quickly understand and contextualise difficult concepts and then b) being able to convey these complex concepts to colleagues or managers. These skills are almost mandatory for uninterrupted career advancement.

There have been many studies on the way people assimilate knowledge and no one shoe fits all. Depending on who you are you will prefer written text, audio, or graphics. My view is that if you can’t  draw it, you don’t  fully understand it. A graphic forces you to summarise your thinking, to organize it tightly into a visual object. Both written and spoken words allow you to describe the same concept from a few different angles and to really elaborate on the idea. A picture is static. Everything you want to say has to be summarised in the graphic and you are limited by the size of the page.

To  get a picture right means that  you really have to understand the concept you are drawing and the interrelationships within it.

There is no right or wrong way to draw a picture. You can use blocks and lines, symbols or a mind map. Once you get the picture right, you will be able to talk to it for an extended period of time.

Sometime back I  was wrestling with  how strategy was related to  a business. I drew the following picture.

diagrame editia 2

I look at the picture today and while I still agree with it, there are parts of it I would change. But at the time I drew it, that was how I understood the world. It summarised a few hundred pages of text. Once I had the picture clear in my head I was confident that I could take any question on the topic and be able to answer it in detail and in the context of how it worked with the rest of the business.

There is no formal methodology for drawing a picture and you need to be patient with yourself. It may take a few days to get the picture to a point where you are comfortable with it.

The underlying assumption of this approach is that any message  you receive, be it a written text, a verbal instruction or lecture, or even a visual event will only contain a half dozen important points. It is these points that you must include in your picture. The trick is identifying the points in the first place. My recommendation is: don’t try too hard. Use an A4 size piece of paper and draw your understanding of what you have just read or heard or seen. Make the picture rich in detail. The more detail, the better. Once you believe you have all the concepts on the page and you have related them to each other, take a new A4 and fold it in half. Now draw the same picture in half the space. It will force you to summarise your first picture. If you can, repeat the exercise with a one-quarter  size piece of paper.

Then reverse the process. When you can draw the summarised picture from memory, then draw the next level of expanded picture and when you have that right, draw the very detailed picture again. When you can do that, then you will find you really have internalised the concepts and you will be able to talk about them fluently. Then, depending on who your audience is, you can produce the appropriately summarised picture on the white board without notes and speak to it with confidence.

The following is another example of a picture I have used for years to describe the business architecture.

9 Point Model (2)

This picture conveys a significant amount of detail without being overly busy. It  describes the  elements of the  business architecture and  the context in which they exist. I now know this picture so well I can speak to it for over an hour if needed. I have also prepared pictures for each of the nine points (shown as blocks). This allows me to drill down into additional detail if necessary.

I have mentored a number of entrepreneurs who have come to me with an idea and the passion to start a business. They will all have prepared detailed business plans, but  when asked to  describe their  idea they invariably battle. My recommendation is always: write up a brochure of one page only with a picture. The potential client must be able to look at the picture and understand your business. The text is supporting detail only. When you can do that, you understand what you are selling.

It is said, a picture speaks a thousand words. This is true and when you have your picture, you will have a thousand words at your fingertips.